Improved debugging with Conveyor and PostSharp Logging
Easily adding automatic logging after development
In this article, let's look at how you can debug an ASP.NET MVC application on your developer machine from other devices on your network or over the internet. We will also show how you can find errors in your code with detailed automatic logging using PostSharp Logging. PostSharp is a Visual Studio extension that adds aspect oriented programming to your project. Conveyor and PostSharp Logging can improve your debugging experience.
Example application
We'll start with an example ASP.NET application: a time tracker that allows users to register time spent working. You can download the code from GitHub.
In the app, we have a “clock in” form where you fill in your hours:
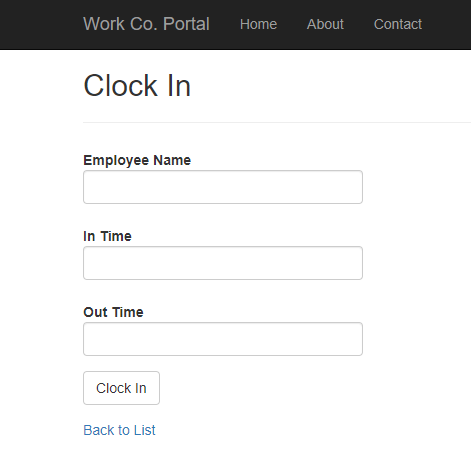
But we also added another feature: if you access the site from a mobile device, the form has an extra field, “location”, so that you register from where you are working. So now we want to test that the extra field indeed displays for mobile devices and that it works.
Debugging over the net
To do that, we'll need a mobile device to connect to the server. This would be easy if the server was publicly accessible but during development, it's probably running on an IIS Express local server that only accepts connections from localhost.
We'll use Conveyor, a free Visual Studio extension, to connect to that server anyway.
Download and install the Conveyor extension and then run the example application from Visual Studio. Conveyor will show you an address-and-port at which you can access the application from other devices on the LAN:
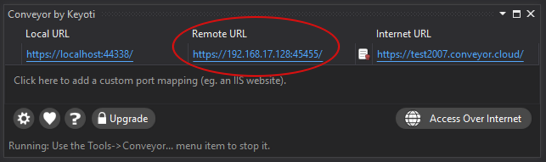
Alternatively (eg. if your test phone isn't on the same LAN), you can also tunnel the connection through a Conveyor server over the internet (instructions). To do this, click “Access Over Internet” and follow the prompts which include registering on the Conveyor website.
Eventually, you will get a URL that you can connect to from your phone or tablet, wherever they are.
Run the application and see that the web-page looks just the same as on desktop. The Location field is not there:
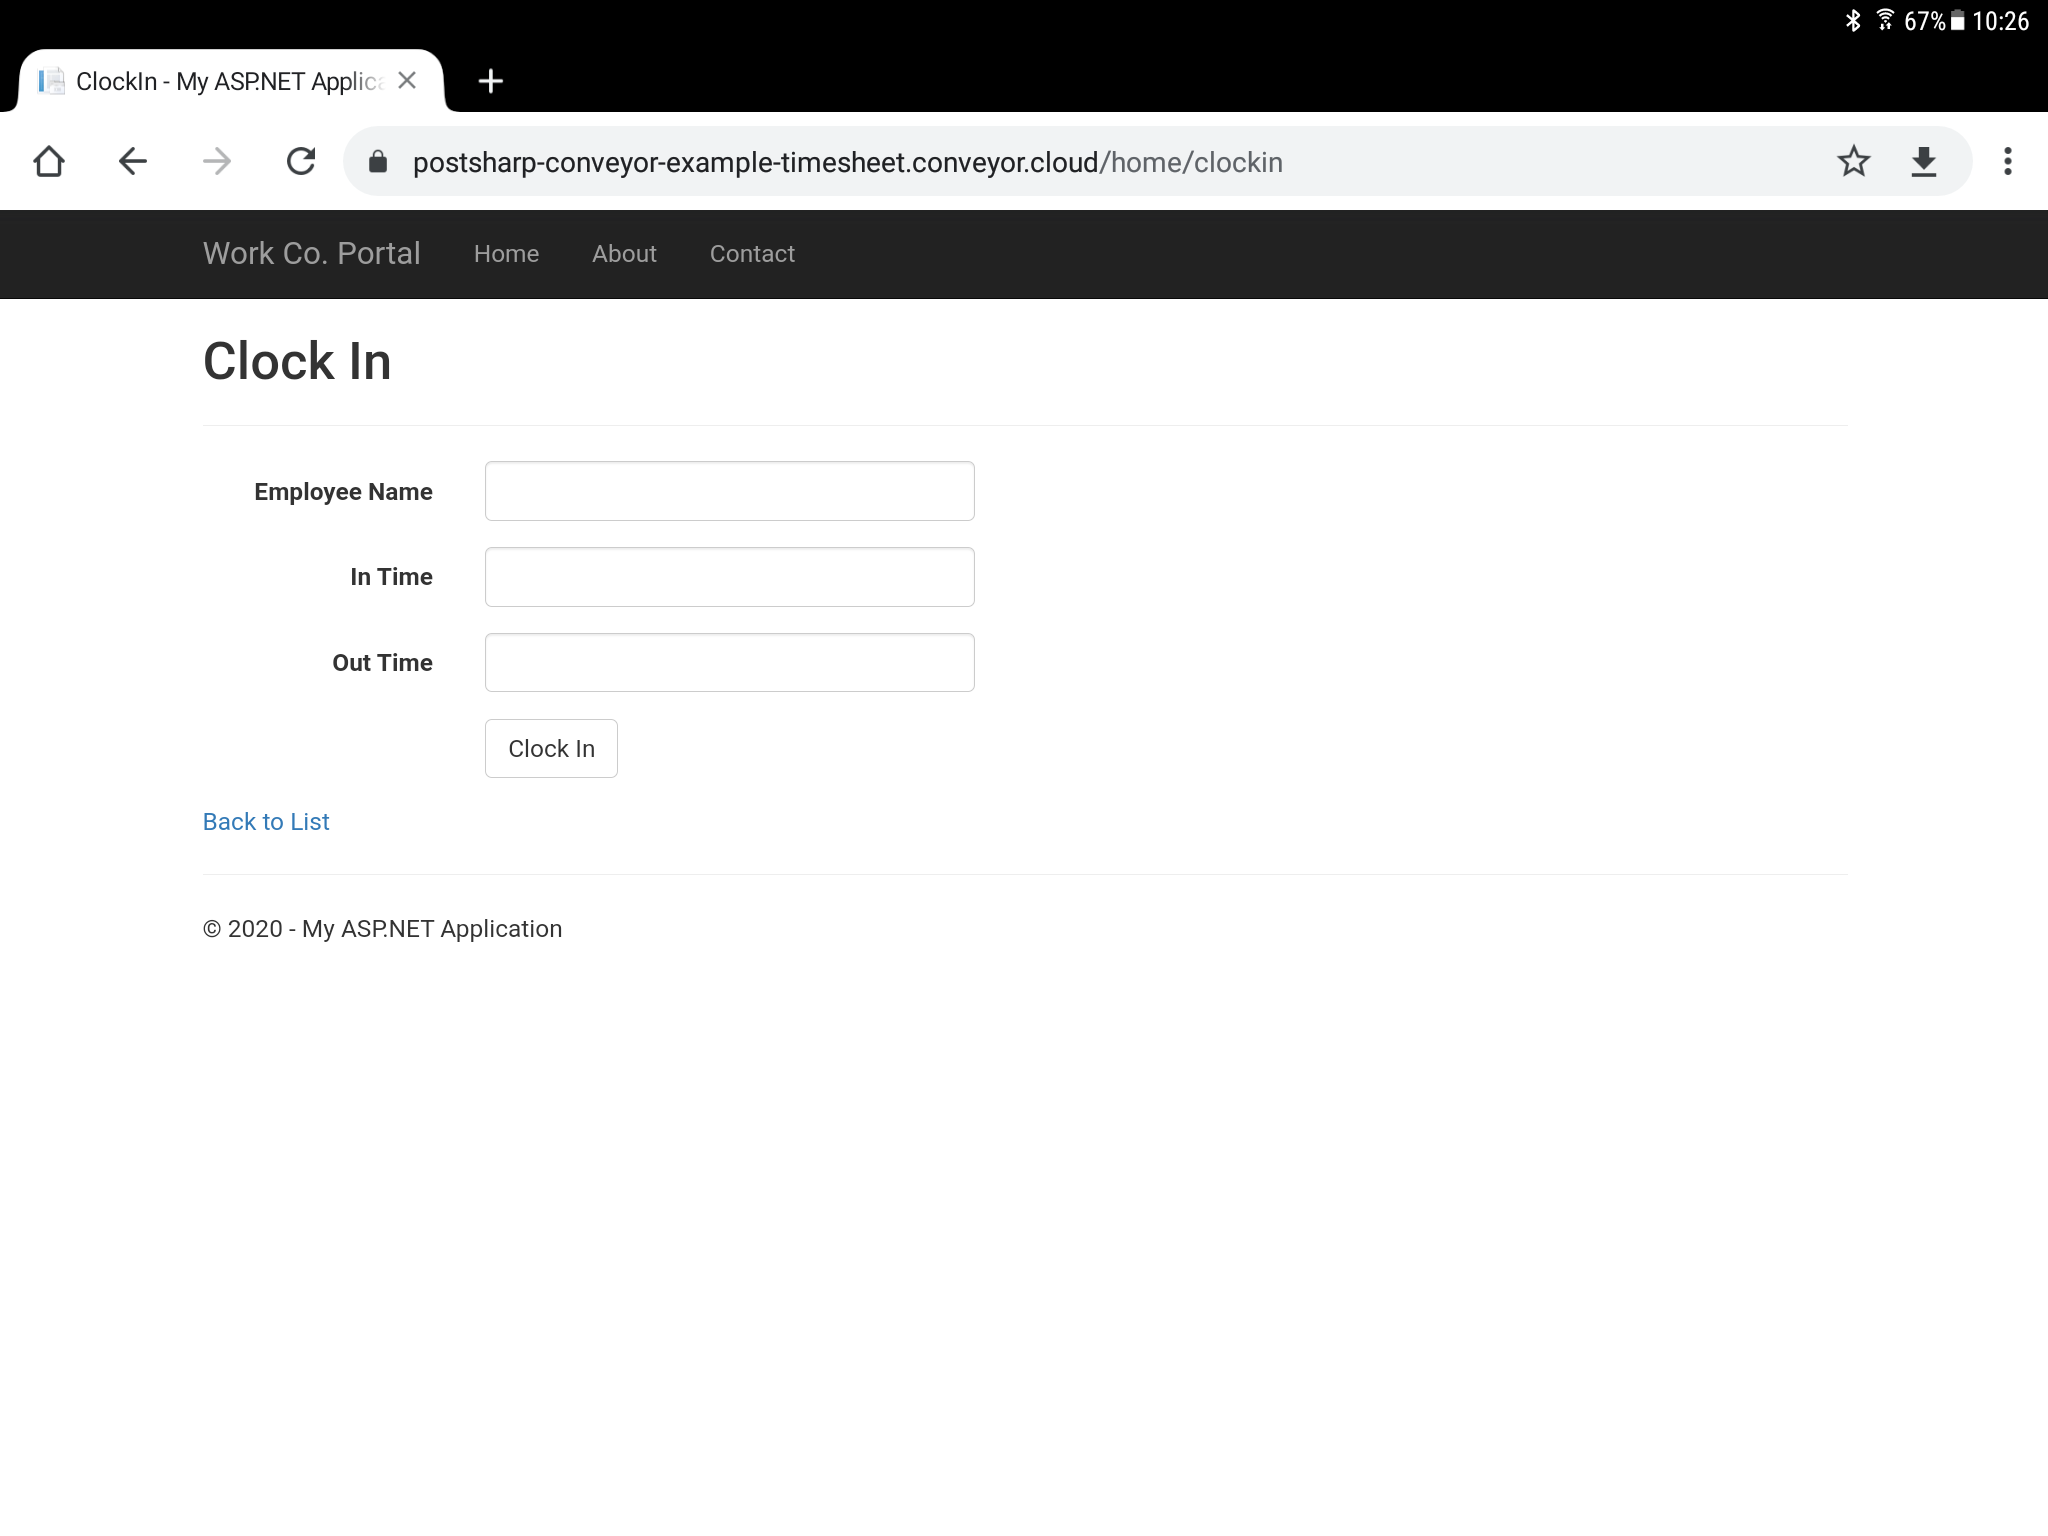
...which is a bug.
Detailed logging
You can think of several places where the bug might be hiding. The HTML or CSS might be bad, the rendering of HTML might have failed, device detection might not have worked right. There are, of course, several ways to tackle this, but in this article, we'll go with analyzing logs.
Now, our application doesn't currently log anything, and we don't want to spend time adding logging everywhere so we'll go with an automatic solution: PostSharp Logging.
Add the following NuGet packages to your project:
- PostSharp.Patterns.Diagnostics
- PostSharp.Patterns.Diagnostics.Serilog
- Serilog.Sinks.File
Then, at the entry point of the application (in our case, that's Application_Start in Global.asax), add the following code:
// Configure Serilog to send logging events to a file:
const string template = "{Timestamp:yyyy-MM-dd HH:mm:ss} [{Level:u3}] {Indent:l}{Message}{NewLine}{Exception}";
Log.Logger = new LoggerConfiguration()
.MinimumLevel.Debug()
.WriteTo.File(@"C:\Logs\log.log", outputTemplate: template)
.CreateLogger();

// Configure PostSharp to send automatic logging to Serilog:
LoggingServices.DefaultBackend = new SerilogLoggingBackend(Log.Logger);
Then, add automatic logging to all methods in your application by adding this line at the beginning of any one file in your project:
// Apply logging to all methods and properties:
[assembly: Log]
You could also target logging more precisely or exclude methods, classes or namespaces with multicasting.
Finally, you will need to get a license for PostSharp Logging, either a free trial or a free Community edition with some limitations. You can install the license either by installing the PostSharp Visual Studio extension or by adding the license to your source code.
Let's now run the program again from Visual Studio, connect to the page from a phone and look in the log file. Here's what we find:
2020-09-24 11:41:47 [DBG] HomeController.ClockIn() | Starting.
2020-09-24 11:41:47 [DBG]   UserDevice..ctor("Mozilla/5.0 (Linux; Android 9; SM-A530F) AppleWebKit/537.36 (KHTML, like Gecko) Chrome/85.0.4183.101 Mobile Safari/537.36") | Starting.
2020-09-24 11:41:47 [DBG]     UserDevice.DetermineDeviceFormat("Mozilla/5.0 (Linux; Android 9; SM-A530F) AppleWebKit/537.36 (KHTML, like Gecko) Chrome/85.0.4183.101 Mobile Safari/537.36") | Starting.
2020-09-24 11:41:47 [DBG] HomeController.Index() | Succeeded: returnValue = {System.Web.Mvc.ViewResult}.
2020-09-24 11:41:47 [DBG]     UserDevice.DetermineDeviceFormat("Mozilla/5.0 (Linux; Android 9; SM-A530F) AppleWebKit/537.36 (KHTML, like Gecko) Chrome/85.0.4183.101 Mobile Safari/537.36") | Succeeded: returnValue = {Desktop}.
2020-09-24 11:41:47 [DBG]     UserDevice.set_Format({Desktop}) | Starting.
2020-09-24 11:41:47 [DBG]     UserDevice.set_Format({Desktop}) | Succeeded.
2020-09-24 11:41:47 [DBG]   UserDevice..ctor("Mozilla/5.0 (Linux; Android 9; SM-A530F) AppleWebKit/537.36 (KHTML, like Gecko) Chrome/85.0.4183.101 Mobile Safari/537.36") | Succeeded.
2020-09-24 11:41:47 [DBG]   UserDevice.get_Format() | Starting.
2020-09-24 11:41:47 [DBG]   UserDevice.get_Format() | Succeeded: returnValue = {Desktop}.
2020-09-24 11:41:47 [DBG] HomeController.ClockIn() | Succeeded: returnValue = {System.Web.Mvc.ViewResult}.
The log file traces how the web request proceeded. The most suspicious line is this:
UserDevice.DetermineDeviceFormat("Mozilla/5.0 (Linux; Android 9; SM-A530F) AppleWebKit/537.36 (KHTML, like Gecko) Chrome/85.0.4183.101 Mobile Safari/537.36") | Succeeded: returnValue = {Desktop}.
It seems the application has a method named DetermineDeviceFormat that accepts a user-agent string and, in this case, returned a value named “Desktop”.
This is a good clue: it is likely that the bug is in identifying whether a device is mobile or desktop and that the body of the method DetermineDeviceFormat is at fault. Sure enough, when we look inside, we find that the method tests the user string for the word “android” rather than “Android” and so fails to identify that the client is mobile.
Conclusion
In this article, we presented two ways to improve your debugging experience: with Conveyor, you gain the ability to access your local development server from other devices, or even from the internet, and with PostSharp Logging, you can add useful detailed and automatic logging.
You can learn more about Conveyor and about PostSharp Logging at their respective websites, and you can download our example project from GitHub.